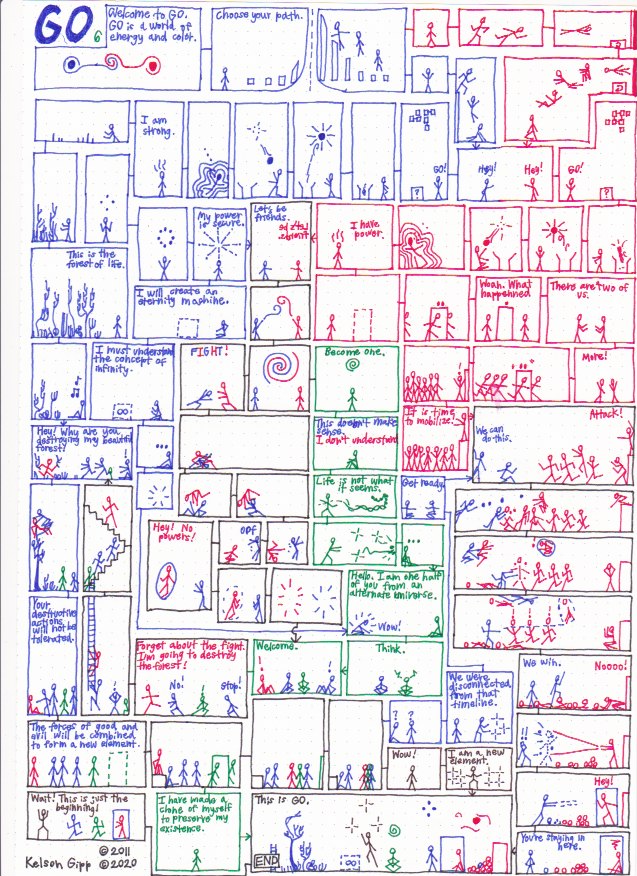
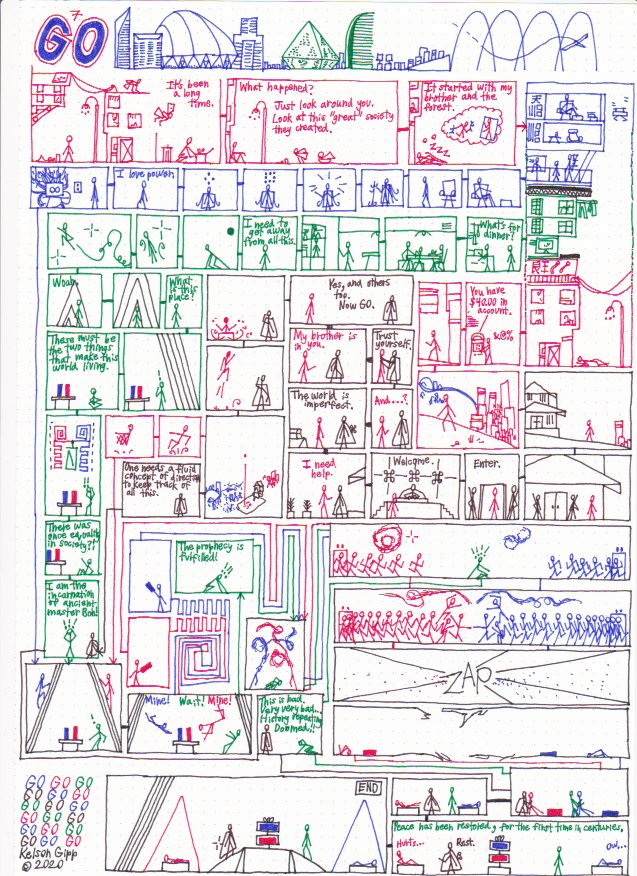
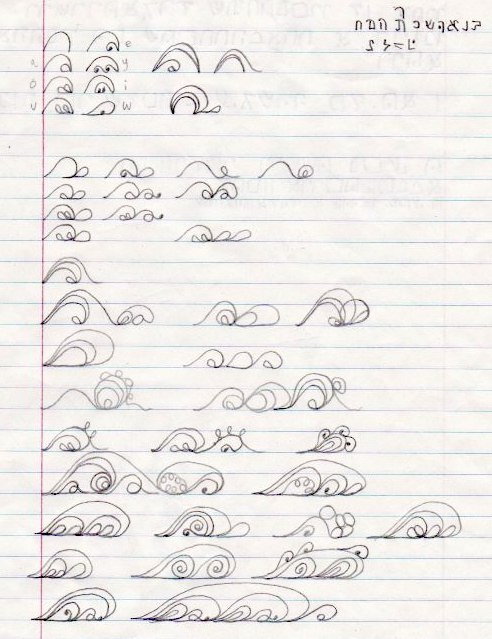
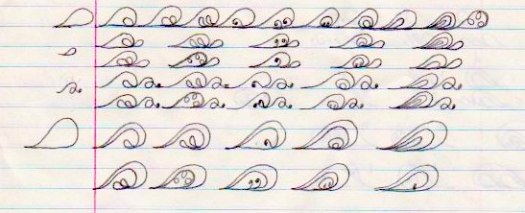
Inspired by Meanwhile by Jason Shiga, I drew up little comics of colored stick figures as a kid. Having grown up and rediscovered them, I was allured by the basic concepts of color and energy and tried my hand at them again in an attempt to remaster the story.
Doing something deeply can help you see things a different way. I build off the work of others and hold on tightly to inspiration when I get it. I found a method someone had created to geometrically construct a Sierpinski triangle using a cloud of points. You just follow some basic rules, a lot of repetition, and the fractal appears out of nowhere. I couldn’t believe it worked, so I had to prove it for myself. I successfully recreated it in a computer program, and going through the act of doing it helped me understand what the maker was thinking.
“It is time for you to turn inwards and start asking yourself the big questions like ‘who are you’ and ‘what do you want.'”
“Who are you?”
This is a quote, written in my original logography, which took many hours of work and practice with much simpler sentences before I was able to express it.
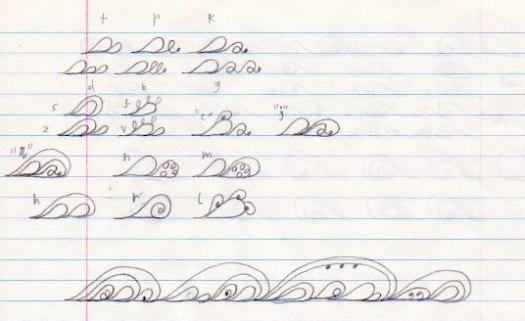
Loop script
For this alphabet, I took inspiration from the way Tolkien organized letters in the Tengwar.
When you start putting the letters together to form words, you see how unique each word can be.
I have a hobby of graphing equations on the Cartesian coordinate plane, not in order to solve any particular problem, but just to notice how they look. I’ve developed an intuitive understanding of what functions make what shapes. I’ve had the most luck with relations and trigonometric functions. Trigonometrics repeat themselves and give rise to complex repeating patterns, like those found in nature. Relations make liberal use of x and y on both sides of the equation, outputting a set of points that makes full use of the 2D space. Combining the two, trigs and relations, has allowed me to discover some astoundingly beautiful graphs. Here are some of my favorites and what I see in them:
Looking at the graph of this equation, it’s hard to believe that it isn’t a hand drawn piece. With rounded shapes of triangles, wavy lines, and crescent moons, you get the feeling it is an ancient people’s depiction of the dreamland.
Most of the equations I come across tend to feel artificial and geometric, but this one curves in some of just the right ways to feel organic. It has big, broad shapes at the centerline and many more smaller ones at the peripheries, which is reminiscent of the scaly skin of an alligator.
“Globby Secant” y + sin(8y) = sec(x)
This graph has a vibe like the Jamba Juice logo and might be able to pass for a funky wallpaper. I think it is a good example of how you can take an easily recognizable function like the secant and build complexity within it.
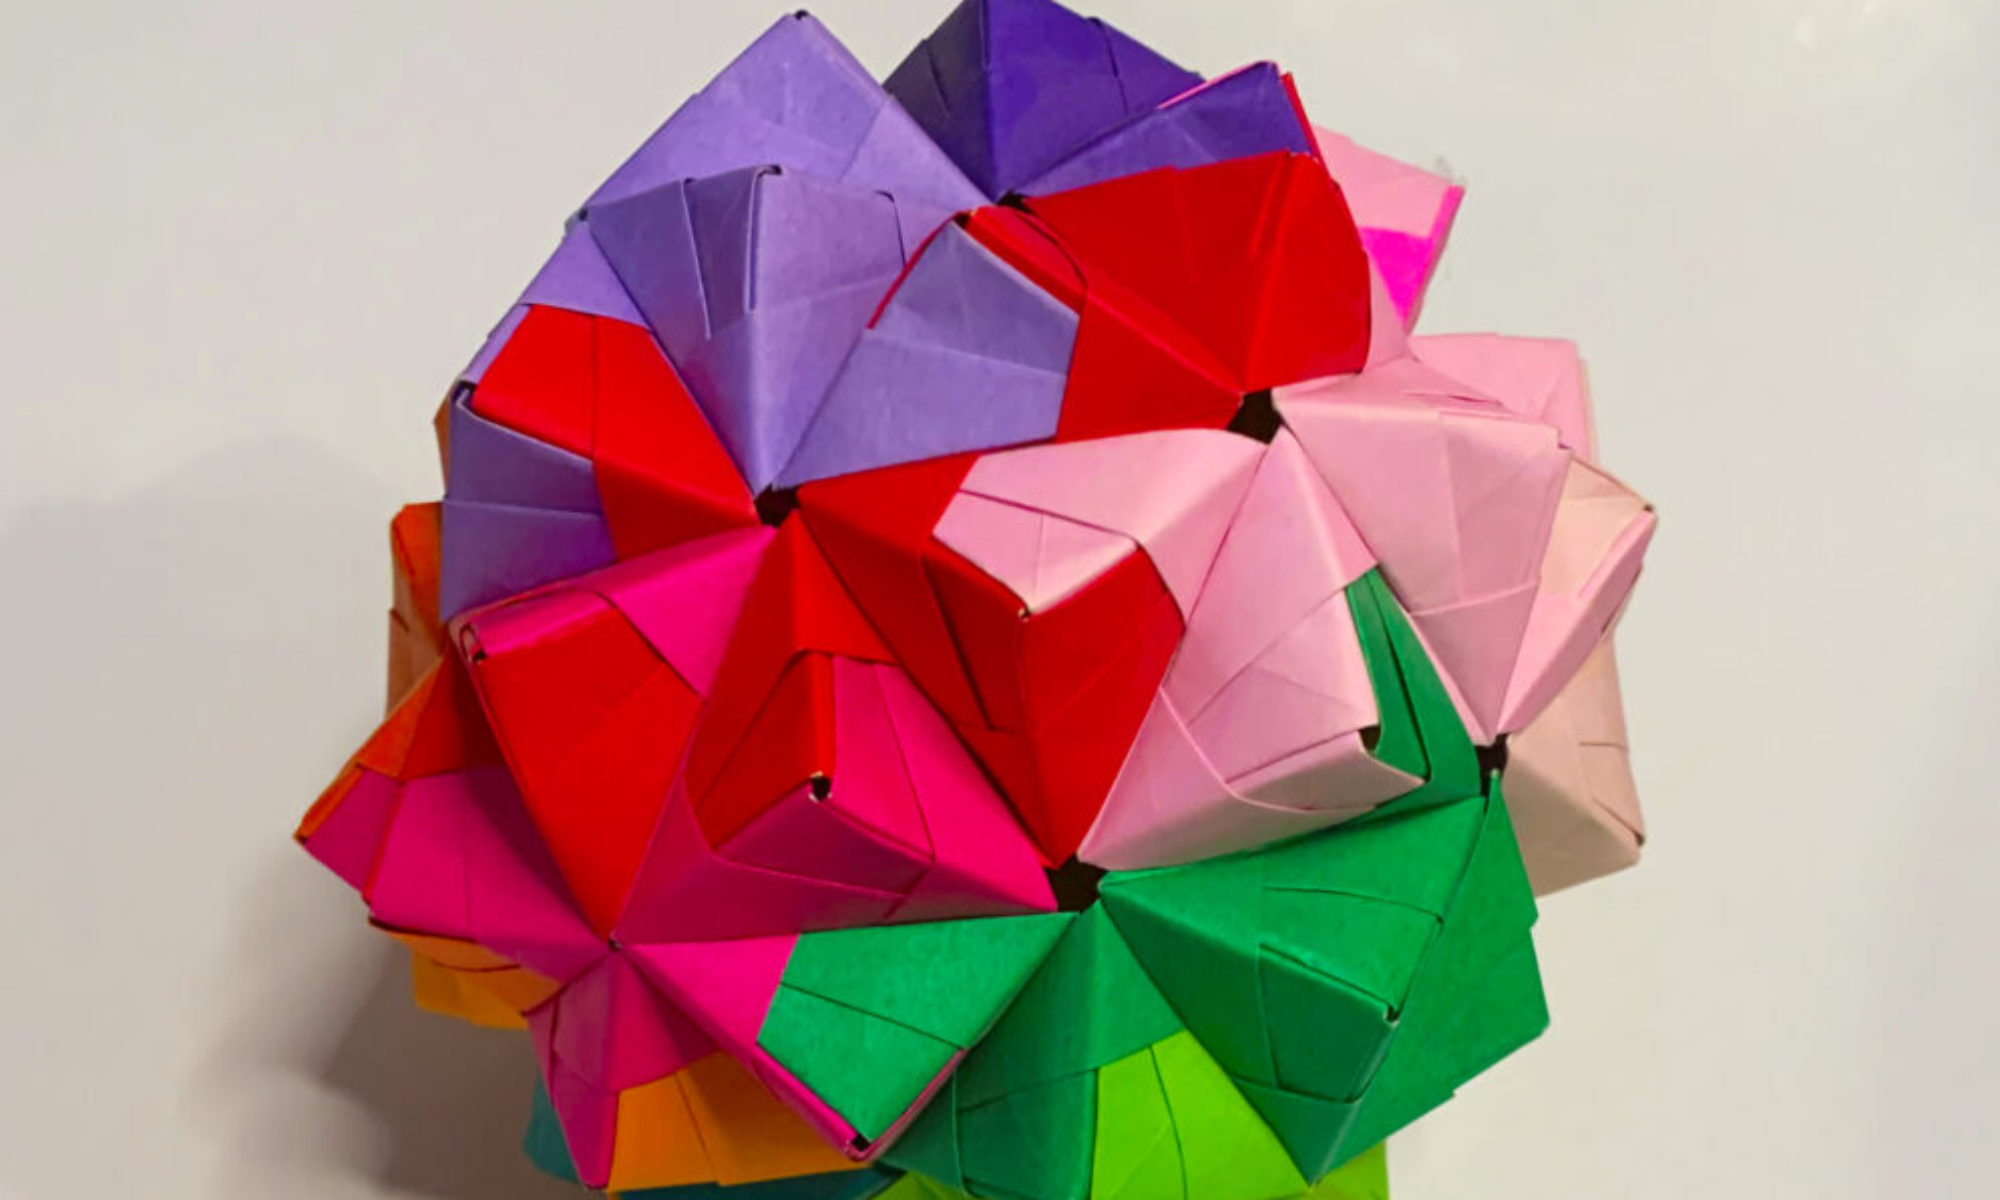
I saw instructions for multiple platonic solids in origami online including octahedrons and icosahedrons, but I hadn’t seen one for a dodecahedron, so I went off what I learned with the others and did it myself:
Each face of the pentagon-sided dodecahedron is broken up into five triangle pyramid spikes. Each pyramid spike contains two origami pieces, so the whole contains 120 pieces total.